Aggregation in POWERBI

An excel is made including two rows as shown in the figure and it is formatted as NUMBER and DATA and clearly specified as TABLE.
we then use this data to make visualization and other work like trend analysis.
Here, we are using POWER BI , from Microsoft Technology.

when you have imported data in POWER BI, you have seen this.
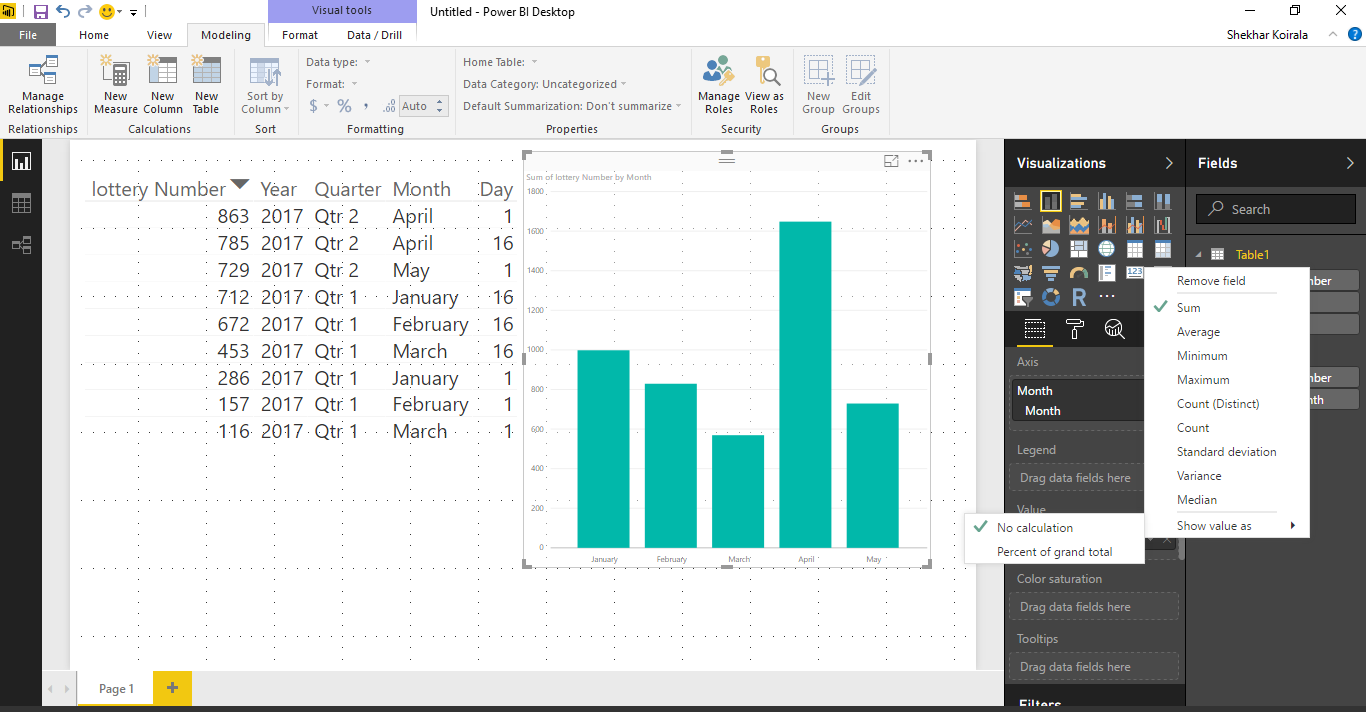
Remember: Data Type : Whole Number
Format : Whole Number
Default SUMMARIZATION : Don't Summarize
This are important aspect to check if you get your data aggregated.
When you put Lottery Number in "value" of Bar diagram( or other diagram) it shows as count of lottery Number which is always one, since no lottery number gonna repeat twice ( yeah some co-incidence happens)
Here date is use as Axis. and following figure shows about the Bar graph.

Comments
Post a Comment